Building a Data-driven AppSec Programme with Kiln
This post is based on a talk I gave at BSides Leeds 2020 on an open source security tooling project I’ve been working on called Kiln.
To set the scene, I’m going to start by talking about CI pipelines. Most of the CI pipelines I’ve seen have performed various types of testing; linting, unit testing, UI testing, maybe some functional testing. Some teams will run security tools as part of their manual code reviews, perhaps using something like Yarn Audit for checking that their JS dependencies don’t have known vulnerabilities in them. More mature CI pipelines might be running security tooling as part of the pipeline itself. At SimplyBusiness, we have tools like Bundler Audit, Rubocop (a linting tool with some security lints) and Brakeman (A Ruby-on-Rails static code analysis tool) in our Ruby app pipelines.
But if a tool finds an issue, someone is going to need to log in to your build server, find the failed build and dig through console logs to find out why a step failed. Putting my developer hat on for a second,that means I’m leaving the environment where I do most of my work (My editor, Slack, GitHub Issues etc), and with my Security Engineer hat back on, I won’t have any visibility that this happened.
I think we can do better than this, and honestly, I think we have to do better than this. A friend of mine once told me that although prioritisation in big companies often meant the difference between delivering something in Q1 or Q3, at smaller companies it’s the difference between doing something now or not doing it. As security teams, our customers aren’t just the customers of the business we work for, our customers are also everyone that works with us. Given how small most security teams are, relative to how many customers they have, prioritisation of where we focus our effort is crucial.
One of the ways I think we can more effectively prioritise our effort is by making data driven decisions. Businesses have been doing this for years; if you look at Business Intelligence, Marketing or UX teams, you’ll find that data is king. It’s working for them, and I think as security professionals, we should follow their lead.
As a security engineer, I want to be able to ask questions like:
- “What projects have which security tools in their CI pipelines?”
- “What vulnerable dependencies do we have in production?”
- “We held some security training recently, have we seen any changes in our security posture since then?”
- “What projects are our biggest source of risk?”
With those questions in mind, I want to introduce you to Kiln.
The value proposition for Kiln is that it makes it easy to run open source security tools, while also collecting data from those tools to allow you to analyse the security of your applications. You can then use the insights you’ve gained from analysing the data Kiln provides to drive better decision making about where to focus your effort and resources.
The following video demonstrates how a user can use the Kiln CLI tool to scan the dependencies of a Ruby application, which uses Bundler-Audit under the hood. These findings are then parsed and processed and sent to Slack as messages to a designated channel. I used an interactive terminal to demonstrate the CLI, but where this really shines is in a CI pipeline.
So how did output from Bundler Audit get to a Slack Channel?
In addition to the CLI tool, which you’ve just seen, there are 4 main components to Kiln:
- The Data collection endpoint
- An Apache Kafka cluster
- The Report parser
- One or more Service connectors
The data collection endpoint serves as a single point for data to enter a Kiln deployment. It performs data validation to ensure that data is good quality and usable by downstream components, serialises data into the Apache Avro format and sends a message to a topic in Kafka. The report parser listens for messages arriving in Kafka on the topic used for unprocessed reports and performs message parsing and data enrichment. For each report from a tool, the report parser will split each finding into it’s own message, and in the case of vulnerable dependencies, will enrich the message with a CVSS score to help illustrate a vulnerability’s severity. Once findings have been parsed and enriched by the report parser, they are then posted back to Kafka on a different topic. Finally, the Slack connector then picks up these processed findings, turns them into human readable messages and posts them to Slack.
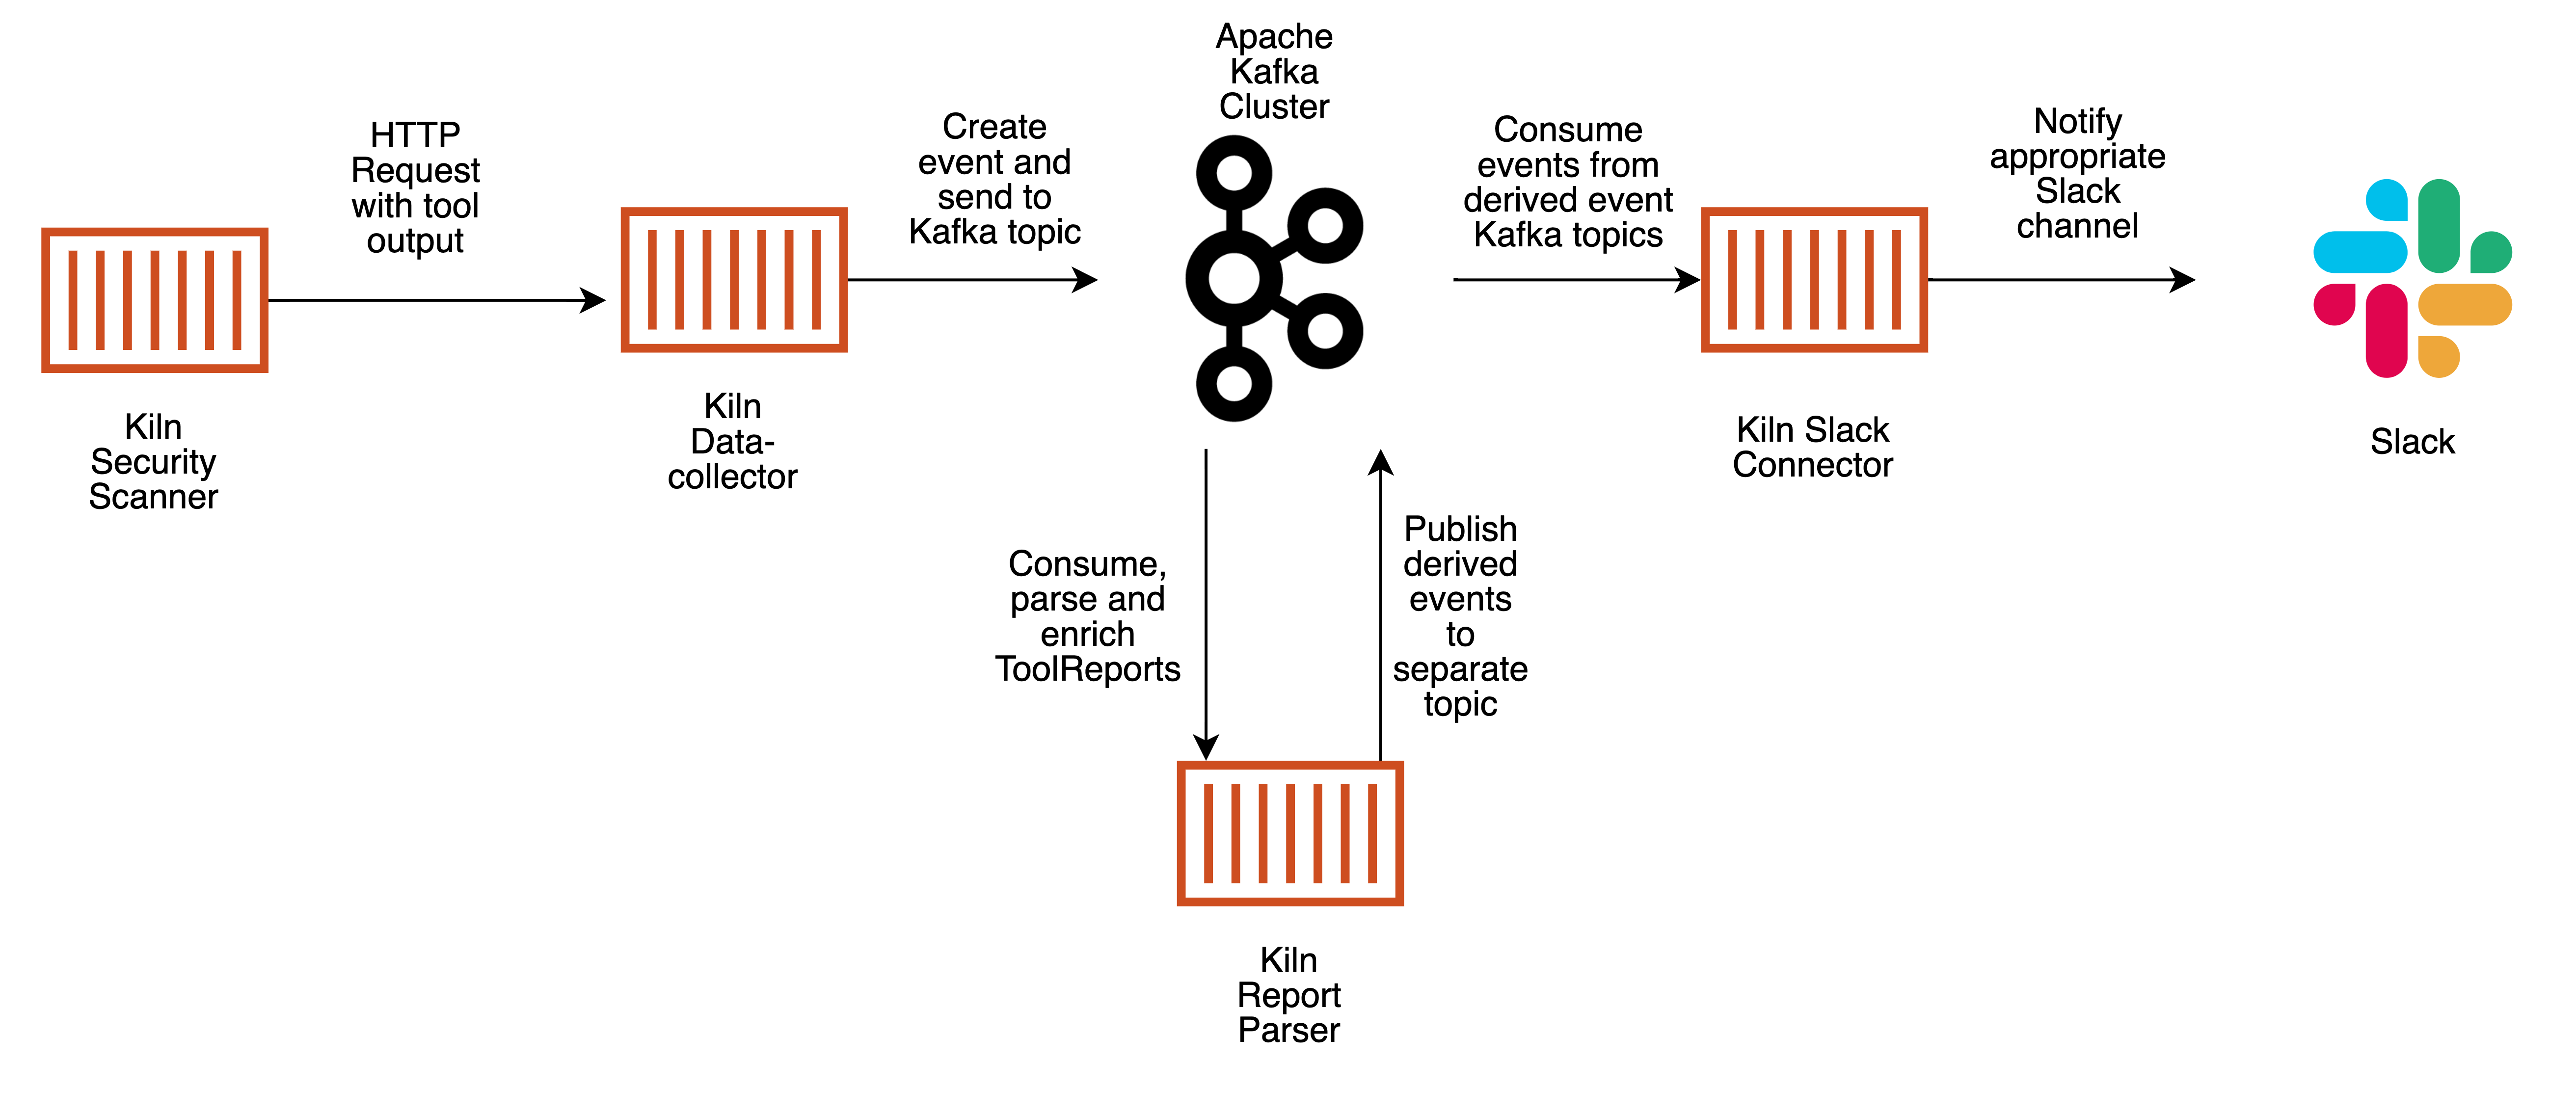
Right now, the only service connector available for Kiln is the Slack connector, but others are planned.
Each of the components in Kiln are small, self-contained services, which can be independently scaled and which allow you to only deploy the service connectors that you would find useful. All of the services are written in Rust for speed and correctness and packaged in Docker containers and everything is MIT licensed.
Before I explain how Kiln’s data can be leveraged to make data-driven decisions, I think it’s important to explain some design aspects.
At the center of Kiln is an Apache Kafka cluster. If you aren’t familiar with Kafka, it’s a distributed, fault-tolerant append-only commit log. A Kafka cluster stores messages in topics, which are partitioned and replicated across multiple brokers in the cluster. This way, if a broker node fails, the other nodes can keep serving requests until a replacement broker is brought online, at which point messages are replicated to the new broker to restore fault-tolerance. Kafka also has a concept called Consumer Groups. This allows multiple replicas of a service to consume messages from a Kafka topic, allowing the numbers of consumers to scale with load and provide High Availability of consumers. For example, if the report parsing service was unable to keep up with the number of incoming messages because part of the data enrichment process was taking multiple seconds, you could scale the number of report parsing replicas to handle the increased load.
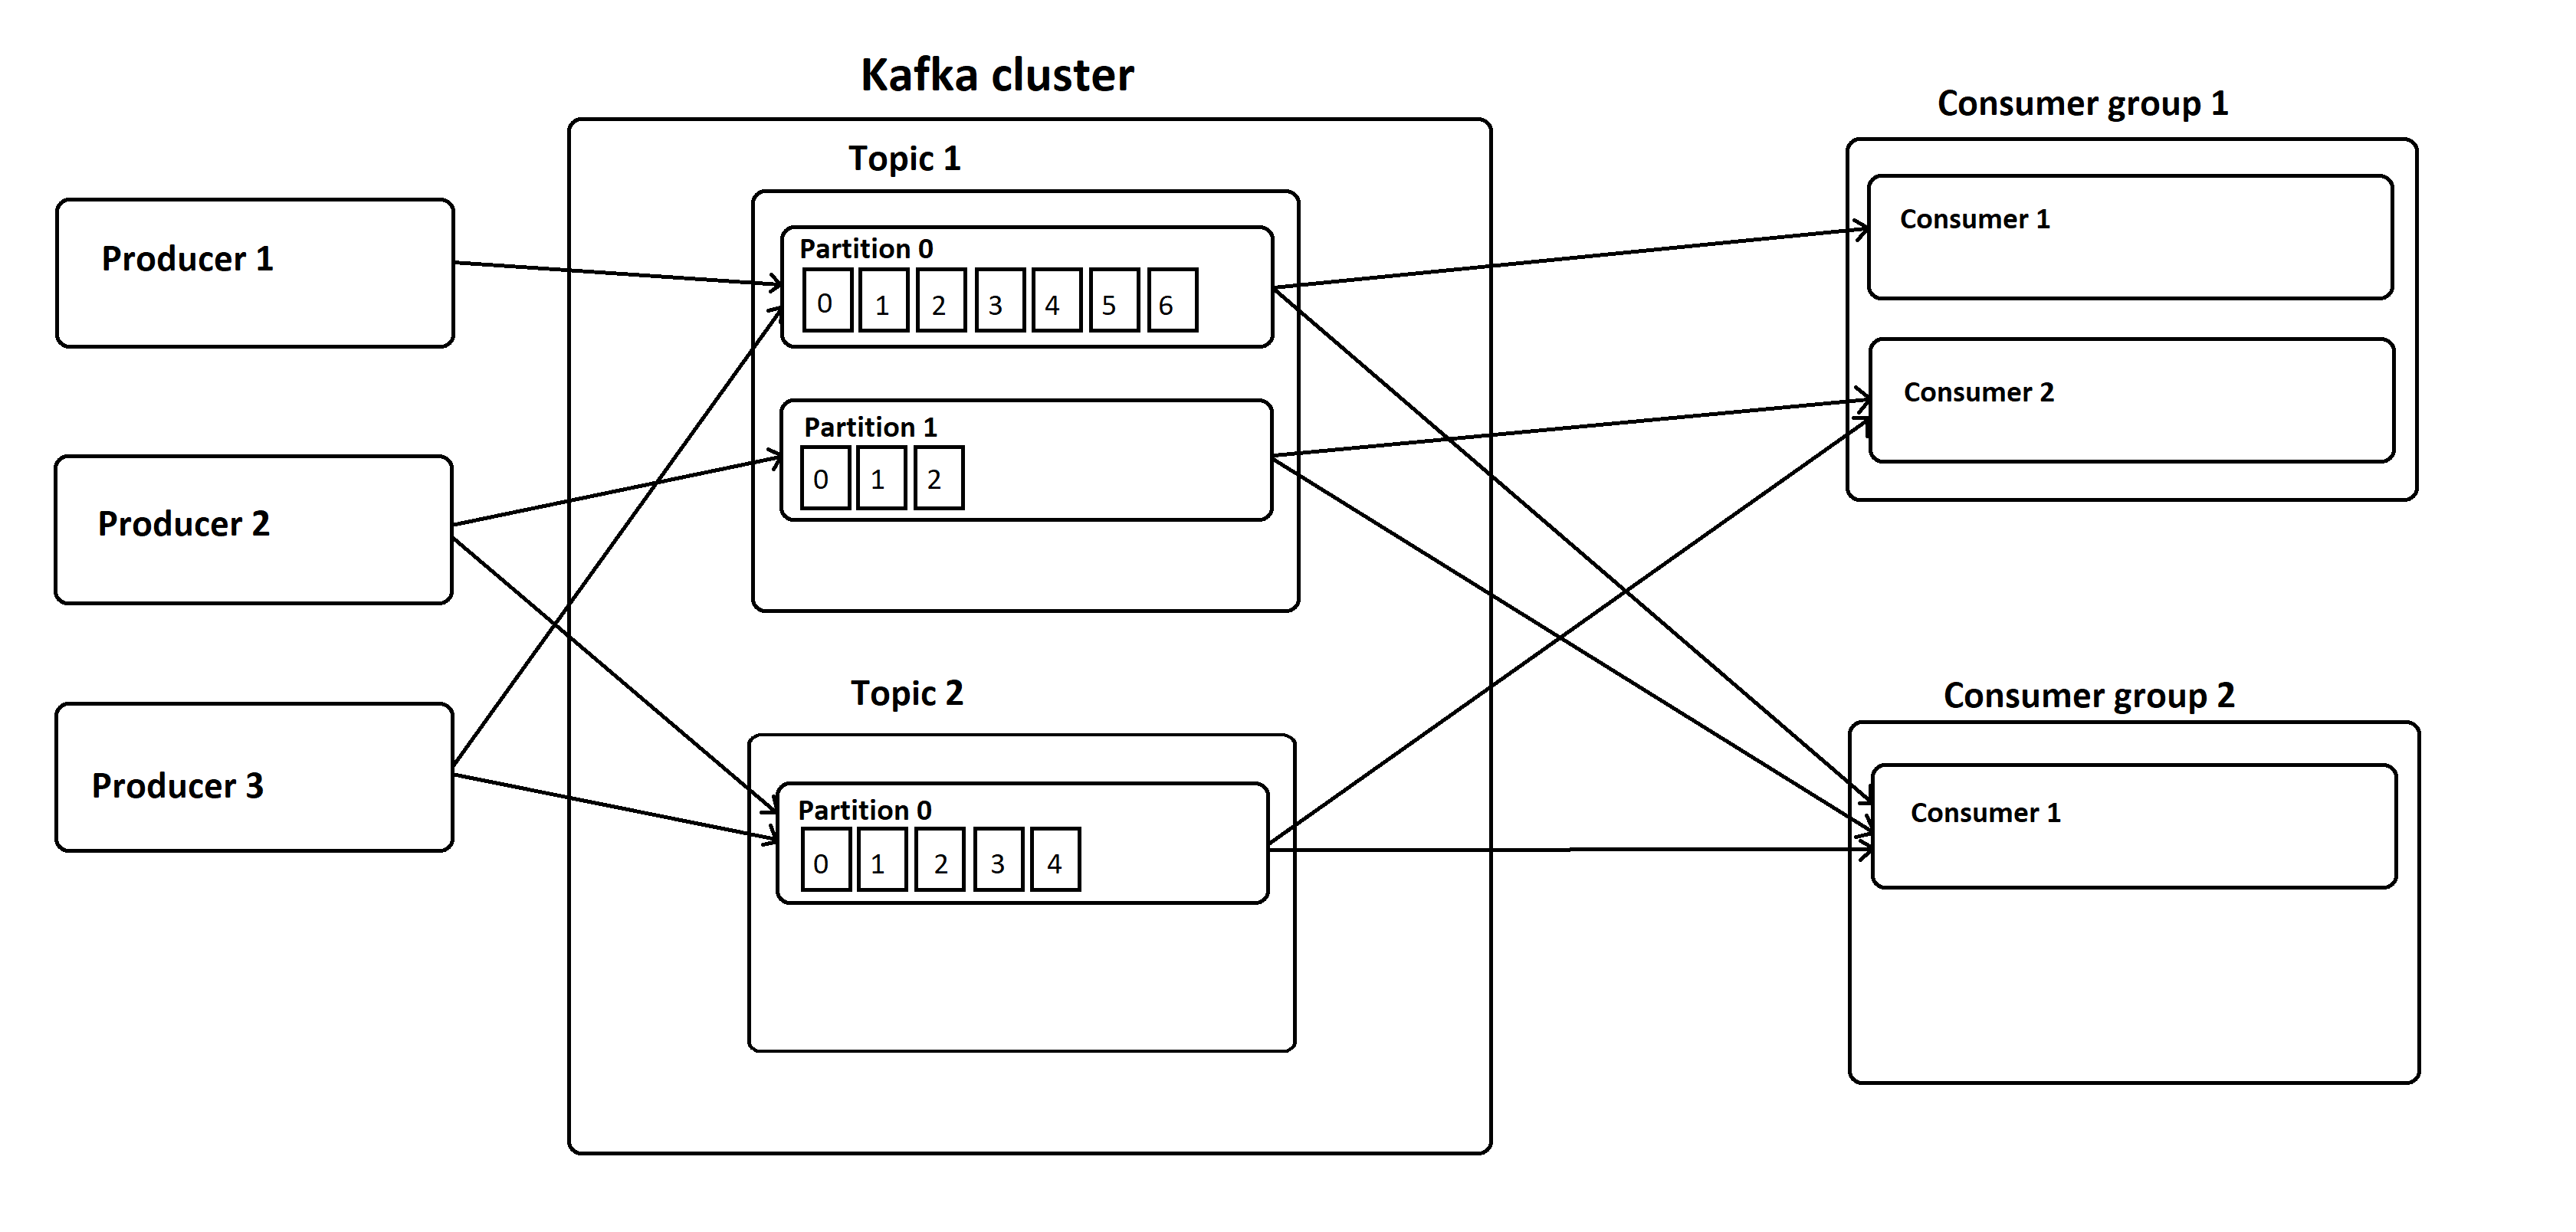
Image courtesy of Novatec Gmbh
The entire system is built using an Event Sourcing architecture, which essentially means that instead of updating the state of the system directly like you would in most applications, you instead record events that represent changes to a system over time, which made Kafka a great fit for storing data for Kiln. Using this architecture, each component in Kiln can then replay each event in a topic and use this to build a view of the data that suits their needs, discarding data they won’t use and storing it in a shape that fulfils their use case.
The Event Sourcing architecture is also a natural fit for building event driven systems that can react quickly to incoming messages, which when coupled with Rust means that the whole system is very fast. In addition to being a good fit for an event driven system, it lends itself to building loosely coupled components, allowing new ones to be plugged in easily.j
But in my opinion, the biggest benefit of Event Sourcing is that because the state of a system can be rebuilt by replaying all of the events from Kafka, it allows you to gracefully recover from certain classes of bugs. For example, say you were building an application for managing bank loans, and you realised that you weren’t calculating how payments should be allocated to paying off interest and the existing loan balance correctly. With an Event Sourcing architecture, you could fix the calculation being performed by an event consumer, redeploy the patched consumer and replay events through the patched version to correct the issue.
So now that I’ve explained a bit about how Kiln works under the hood, let’s get into some data analysis. The question I’m going to answer is: “For three open source Ruby projects (OWASP RailsGoat, Mastodon and GitLab), how long does it take them on average to find and fix a vulnerability in one of their dependencies on their default branch”.
To answer that question, I ran Bundler-audit using the Kiln CLI on every commit to each project’s default branch and fed the results into a Kiln stack I had deployed in AWS. I then wrote a Jupyter notebook using Python to interactively explore the data. I used Apache Spark Streaming to read data in from the parsed findings Kafka topic and did a lot of the heavy lifting with the Pandas Python library.
The approach I used to answer that question isn’t the only way you can leverage the data that Kiln provides. My approach was to analyse data in a batched fashion, but there’s no reason that same analysis couldn’t be performed in a streaming fashion and be used to power a live dashboard. Additionally, while Jupyter notebooks are great for interactive analysis, that same analysis could be packaged as a single Python script, to deliver the same results without requiring someone to setup Jupyter and run each cell individually.
Kiln is still a relatively young project, so what does the future hold? All of Kiln’s development is tracked using Github issues, which you can find at https://github.com/simplybusiness/Kiln/issues. At the time of writing, some of the highlights include:
- Building a reporting dashboard, to enable you to quickly see things like what projects are using what tools, in what environments and how often are they run?
- Adding tools for other languages, next up being Python and Javascript. Right now Kiln is at it’s MVP, which only supports Ruby applications.
- Tools beyond source code scanning. For example, ScoutSuite from NCC Group for auditing cloud environments and Clair for scanning Docker images.
- More service connectors, such as Github Issues, Trello and Jira
If after reading this, you’re interested in trying Kiln out for yourself, you can find the source and documentation at https://github.com/simplybusiness/Kiln. The repo also has a quickstart guide and a walkthrough of replicating the data analysis demo I included in this post.